Price & Momentum Reversal Indicator
Master Market Reversals With Precision
The Price & Momentum Reversal Indicator gives you a critical edge that most traders lack: the ability to identify potential market turning points before they fully develop. While the market crowd chases trends that are already exhausted, you'll be positioned for the reversal with confidence and precision.
This powerful technical tool combines advanced momentum analysis with price action patterns to detect when a market is reaching extreme conditions and likely to reverse direction. The result? High-probability trading opportunities at optimal entry points.
Why Most Traders Miss Reversals (And How You Won't)
Capturing reversals is one of trading's greatest challenges. Most traders either:
- Enter too early and get caught in false reversals
- Enter too late after the best opportunity has passed
- Miss signals entirely by using lagging indicators
The Price & Momentum Reversal Indicator solves these problems with a sophisticated momentum detection system that identifies when markets reach extreme conditions and begin shifting direction. You'll see clear, actionable signals exactly when markets are most likely to reverse.
Key Components That Power Your Trading Edge
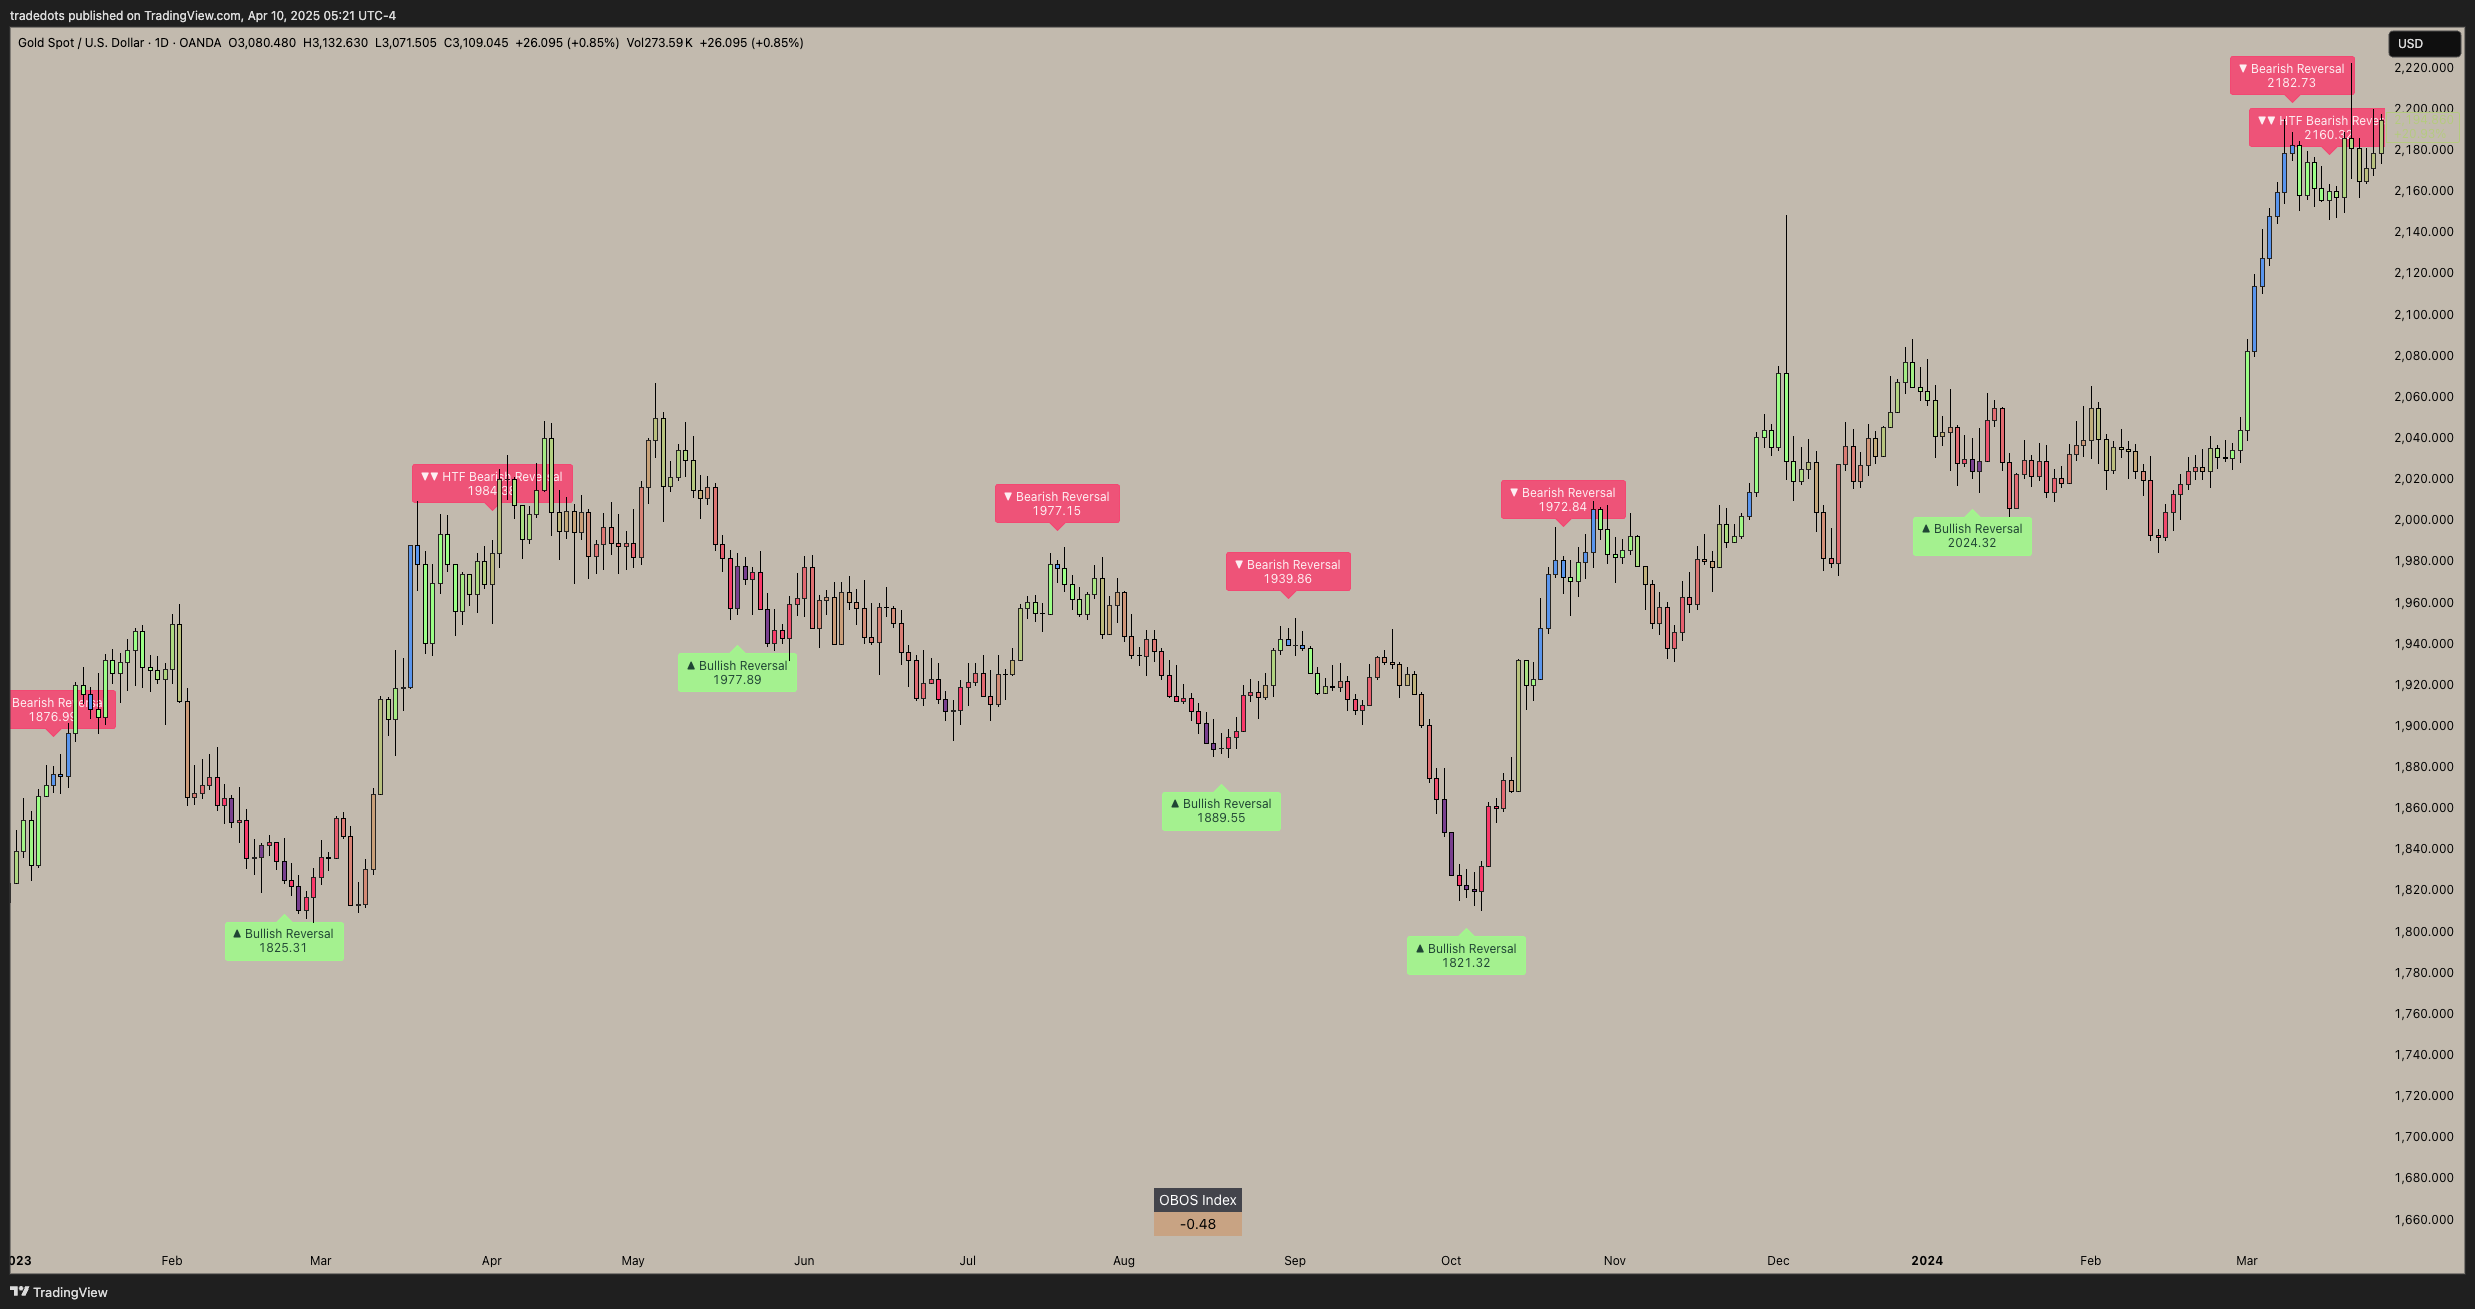
1. OBOS (Overbought/Oversold) Index
The heart of the indicator is our proprietary OBOS Index, displayed in an easy-to-read panel:
- Advanced Momentum Measurement: Uses a modified Chande Momentum Oscillator (CMO) for superior sensitivity
- Clear Range: Typically spans from -100 (extremely oversold) to +100 (extremely overbought)
- Color-Coded Visualization: Instantly see market conditions with intuitive color gradients
- Customizable Thresholds: Default settings identify overbought conditions above +40 and oversold below -40
- Volume Integration: Optional volume-weighting for enhanced accuracy in liquid markets
2. Precision Signal System
The indicator generates four distinct signal types to identify the highest-probability reversal opportunities:
Primary Signals:
- Bullish Reversal (▲): Appears when price is oversold and momentum begins turning upward – your signal to consider buying
- Bearish Reversal (▼): Appears when price is overbought and momentum begins turning downward – your signal to consider selling
Higher Timeframe (HTF) Signals:
- HTF Bullish Reversal (▲▲): Confirms bullish signals on a higher timeframe – significantly increasing probability
- HTF Bearish Reversal (▼▼): Confirms bearish signals on a higher timeframe – significantly increasing probability
3. Comprehensive Visual System
The indicator transforms complex data into clear visual insights:
- OBOS Panel: Displays current momentum with intuitive color gradients
- Signal Labels: Appear directly on your chart with customizable information
- Candlestick Coloring: Optional coloring based on momentum conditions for enhanced visualization
- Clean Interface: Designed for clarity without cluttering your charts
Trading Strategies For All Experience Levels
For New Traders: The Reversal Basics Strategy
Perfect if you're just starting your trading journey:
-
Identify Extreme Conditions:
- Look for the OBOS Index to reach high readings (above +60) or low readings (below -60)
- These extreme readings indicate markets that are overextended and prime for reversal
-
Wait for Signal Confirmation:
- Enter long positions when you see a bullish reversal signal (▲) in oversold conditions
- Enter short positions when you see a bearish reversal signal (▼) in overbought conditions
-
Manage Your Risk:
- Place stop losses beyond the recent swing high/low
- Target the next significant support/resistance level
- Use a fixed 1:2 risk-to-reward ratio minimum
-
Recommended Settings:
- Start with default thresholds (40/-40)
- Enable "Show Labels" for clear visual signals
- Use "Full" candlestick coloring for better momentum visualization
For Intermediate Traders: The Multi-Timeframe Confirmation Strategy
Elevate your trading with this more sophisticated approach:
-
Align With Higher Timeframes:
- Enable the Higher Timeframe Analysis feature
- Look for situations where both primary and HTF signals align (▲ with ▲▲, or ▼ with ▼▼)
- These "double-confirmed" signals have significantly higher probability
-
Fine-Tune Your Entries:
- Wait for price to close beyond the signal candle for additional confirmation
- Use support/resistance levels to optimize entry points
- Consider adding volume confirmation for stronger signals
-
Advanced Risk Management:
- Use tighter stops due to higher signal reliability
- Implement scaled entries at key levels
- Consider partial profit-taking at first targets while letting remainder run
For Advanced Traders: The Complete Reversal System
Maximize your edge with this comprehensive approach:
-
Customize For Your Markets:
- Adjust the "Sensitivity (Length)" parameter based on your market's volatility
- Enable "Volume Weighted" for stocks and futures where volume is meaningful
- Fine-tune overbought/oversold thresholds based on historical performance
-
Integrate With Market Structure:
- Combine with support/resistance levels for precision entries
- Use with trend analysis to differentiate between counter-trend opportunities and major reversals
- Look for divergences between price and the OBOS Index for additional confirmation
-
Implement Professional Risk Management:
- Scale into positions at key levels rather than entering all at once
- Use time-based exits for trades that don't develop quickly
- Implement trailing stops to protect profits on successful reversals
Real-World Trading Examples
Example: Catching a Major Bottom in Bitcoin
In this Bitcoin (BTCUSD) 4-hour chart example:
- The Setup: Bitcoin had been in a strong downtrend for several weeks
- Extreme Condition: The OBOS Index reached an extremely oversold reading of -85
- The Signal: A bullish reversal signal (▲) appeared as momentum began shifting upward
- Higher Timeframe Confirmation: Shortly after, an HTF bullish signal (▲▲) confirmed
- The Result: Bitcoin rallied over 15% in the following days, providing an excellent risk-reward opportunity
Example: Identifying a Bearish Reversal in Tesla
In this Tesla (TSLA) daily chart example:
- The Setup: Tesla had been in a strong uptrend, reaching overbought conditions
- Extreme Condition: The OBOS Index reached +78, indicating extreme overbought conditions
- The Signal: A bearish reversal signal (▼) appeared as momentum began to fade
- Higher Timeframe Confirmation: The weekly chart also showed overbought conditions
- The Result: Tesla corrected by over 12% in the following sessions before finding support
Customization: Tailoring The Indicator To Your Trading Style
Indicator Settings
- Source: Select the price data used in calculations (default: close)
- Sensitivity (Length): Adjust the lookback period for momentum calculation (default: 7)
- Lower values (5-6): More sensitive, more signals, better for volatile markets
- Higher values (8-10): Less sensitive, fewer but stronger signals, better for stable markets
- Volume Weighted: Toggle to incorporate volume into momentum calculations
- Recommended for stocks, futures, and crypto where volume data is reliable
- Not recommended for forex where volume data is less meaningful
Strategy Settings
- Label Direction: Filter to show only Long signals, Short signals, or both
- Overvalued/Undervalued Threshold: Adjust when markets are considered overbought/oversold
- Default (40/-40): Balanced for most markets
- Tighter (30/-30): More signals, lower reliability
- Wider (50/-50): Fewer signals, higher reliability
Visual Settings
- Show Labels: Toggle signal labels on the chart
- Label Type: Customize information displayed in labels
- Candlestick Coloring: Change how price bars are colored based on momentum
- OBOS Panel Location & Size: Customize the momentum display panel
Pro Trading Tips: Maximizing Your Success Rate
1. Confluence Is Key
The most powerful reversal signals occur when multiple factors align:
- Extreme OBOS readings (above 70 or below -70)
- Higher timeframe confirmation signals
- Price at key support/resistance levels
- Volume confirmation (increasing volume on reversal)
2. Respect Market Context
Not all reversals are created equal:
- In strong trends, look for deeper OBOS readings before counter-trend entries
- In ranging markets, more moderate OBOS readings can signal reliable reversals
- During high volatility periods, wait for additional confirmation before entry
3. Optimize For Your Timeframe
Different trading styles require different approaches:
- Day Traders: Use 5-minute to 1-hour charts with slightly lower sensitivity
- Swing Traders: Focus on 4-hour and daily charts with default settings
- Position Traders: Use daily and weekly charts with higher thresholds
4. Combine With Other TradeDots Indicators
Create a complete trading system:
- Use with Smart MACD Reversal Oscillator Pro for divergence confirmation
- Combine with Trend Following Buy Sell Signals for trend context
- Add Market Structure Indicator to identify key levels and patterns
Frequently Asked Questions
Q: How often should I expect to see signals?
A: With default settings on a 4-hour chart, you might see 2-5 signals per week on most markets. Higher sensitivity settings or lower timeframes will generate more signals, while lower sensitivity or higher timeframes will produce fewer but higher-quality signals.
Q: Which markets work best with this indicator?
A: The Price & Momentum Reversal Indicator works effectively across all major markets:
- Forex: Excellent for major and minor pairs
- Cryptocurrencies: Particularly effective due to their tendency to reach extreme conditions
- Stocks: Works well, especially with volume weighting enabled
- Commodities: Very effective for capturing major turning points
Q: What's the best timeframe to use?
A: While the indicator works on all timeframes, the 1-hour, 4-hour, and daily charts typically provide the most reliable signals with the best risk-to-reward ratios. Lower timeframes generate more signals but with higher noise, while higher timeframes produce fewer but stronger signals.
Q: How does this compare to other reversal indicators?
A: Unlike traditional oscillators (RSI, Stochastic) that only measure overbought/oversold conditions, the Price & Momentum Reversal Indicator:
- Identifies the exact candle where momentum begins to shift
- Provides higher timeframe confirmation
- Offers volume integration for enhanced accuracy
- Shows clear, actionable signal labels directly on your chart
Q: Can I use this indicator alone, or should I combine it with others?
A: While the indicator can be used successfully on its own, combining it with complementary tools enhances your edge:
- Use with trend indicators to understand the larger context
- Add support/resistance tools for precise entry/exit points
- Consider volume indicators for additional confirmation
Take Your Trading To The Next Level
The Price & Momentum Reversal Indicator transforms how you identify and trade market turning points. By providing clear, actionable signals at optimal reversal points, it helps you:
- Enter earlier in potential reversals with confidence
- Filter out low-probability setups
- Confirm reversals with higher timeframe analysis
- Visualize momentum shifts with intuitive displays
Whether you're a new trader learning to spot opportunities or an experienced professional refining your edge, this powerful indicator gives you the precision tools to capitalize on high-probability reversal points across any market and timeframe.